다우 존스 산업 평균은 경고합니다 : 신용 부채가 위험하게 높다 신용 부채는, 사람들이 주식을 매입하기위해 빌리는 금액은 사상최고일 뿐만 아니라. 가속하고있다 여백의 부채 수준은 반드시 임박하지 않았지만 주식 시장 폭락은 더욱더 가능성이되고 있고 또 다른 표시이다. 뉴욕 증권 거래소 자료에 따르면, 마진 부채는 1월달 말에 잇달아 5번째 기록적으로 4513억달러에 도달했습니다. 높은 마진의 빚이 가고 있다, 더 많은 가능성이 주식 시장 폭락, 또는 적어도 급락이 됩니다. "채무가 올라가면, 시장의 기초가 더욱 휘청거리고,"브래드 맥밀런, 연방 재정에 대한 최고 투자 책임자는 마켓 워치에 말했다.
여백의 부채를 기록하다 이것에 대해, 특히 불길한 것은 지난2년 심하게 시장을 충돌하였고 2000 년 닷컴 파열 2007-2008년의 금융 위기는, 모두 부채의 날카로운 스파이크를 앞세웠습니다. 차트를 살펴 보자. 그것은 인플레이션을 조정된 1995 년 이후 S & P 500 지수 및 여백 부채의 비율 증가를 보여줍니다. 1999 년과 2006-2007년 마진 부채의 가파른 상승을 합니다. 각각 피크의 주요한 주식 시장은 몇 달 후 충돌하였다. 국내 총생산 (GDP)의 비율로 신용 부채도 급증하고 있습니다. 1 월 말에, 그것은 2007 년 7 월에 도달되고, 2000 년 3 월에 명중한 2.78 %에 접근하는 2.62 %보다 높은 2.64 %를 기록했다. 미국 연방 준비 제도 이사회의 역사적으로 낮은 금리가 싼 돈을 많이 제공함으로써 마진 부채의 수준을 높이는데 큰 역할을하는 것이 사실이지만, 그것은 차입하고 있는 최근 가속도를 잘 해명 할 수는 없다. "신용 부채가 금융 위기가 시작되고 볼륨이 시장이 최대의 실수인 동시에 하락하는 때보다 높은 수준에서 지금,"돈 아침 최고 투자 전략가 키스 피츠 - 제럴드씨는 말했다. " 사람들이 초기의 황소 시장 랠리에서(상승) 경우와 같이, 오히려 실제 결과를 쫓는 것보다 수익을 추구하는 시도하는 칼자루에 자신을 활용하는 것을 제안합니다." 그리고 스파이크 마진 부채는 상단 근처가 될 수 있다는 것을 신호하고 있는 시장에 표시되지 않습니다. Dow Jones Industrial Average Warning: Margin Debt Is Dangerously High
Margin debt, the amount of money people have borrowed to buy stocks, is not only at a record high – it’s accelerating.
This margin debt level is another sign that a stock market crash, while not necessarily imminent, is becoming more and more likely.
According to New York Stock Exchange data, margin debt reached $451.3 billion at the end of January – the fifth record month in a row.
The higher the margin debt goes, the more likely a stock market crash, or at least a sharp correction, becomes. “As that debt goes up, the market’s foundation gets shakier and shakier,” Brad McMillan, chief investment officer for Commonwealth Financial, told MarketWatch.
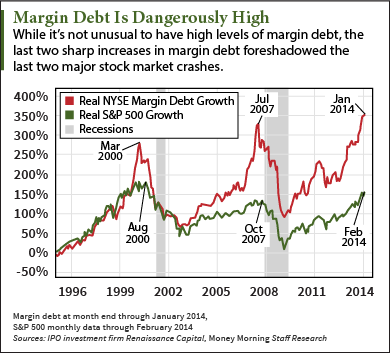
What’s especially ominous about this is that the last two severe market crashes, the dot-com bust of 2000 and the financial crisis of 2007-2008, were both preceded by sharp spikes in margin debt.
Take a look at the chart. It shows the percentage gain of the Standard & Poor’s 500 index and margin debt since 1995, adjusted for inflation.
Note the steep rises in margin debt in 1999 and 2006-2007. Each peak was followed a few months later by a major stock market crash.
Margin debt as a percentage of gross domestic product (GDP) is also soaring. At the end of January, it hit 2.64%, higher than the 2.62% it reached in July 2007 and approaching the 2.78% it hit in March of 2000.
And while it’s true that the U.S. Federal Reserve‘s historically low interest rates have played a big role in raising the levels of margin debt by providing a lot of cheap money, it can’t totally explain away the recent acceleration in borrowing.
“Margin debt is now at levels higher than when the financial crisis began and volume is declining at the same time the markets have chipped up,” said Money Morning Chief Investment Strategist Keith Fitz-Gerald. “This suggests that people are leveraging themselves to the hilt in an attempt to pursue returns rather than chasing actual results, as is the case in early bull market rallies.”
And spiking margin debt is not the only market indicator signaling that a top may be near. |